
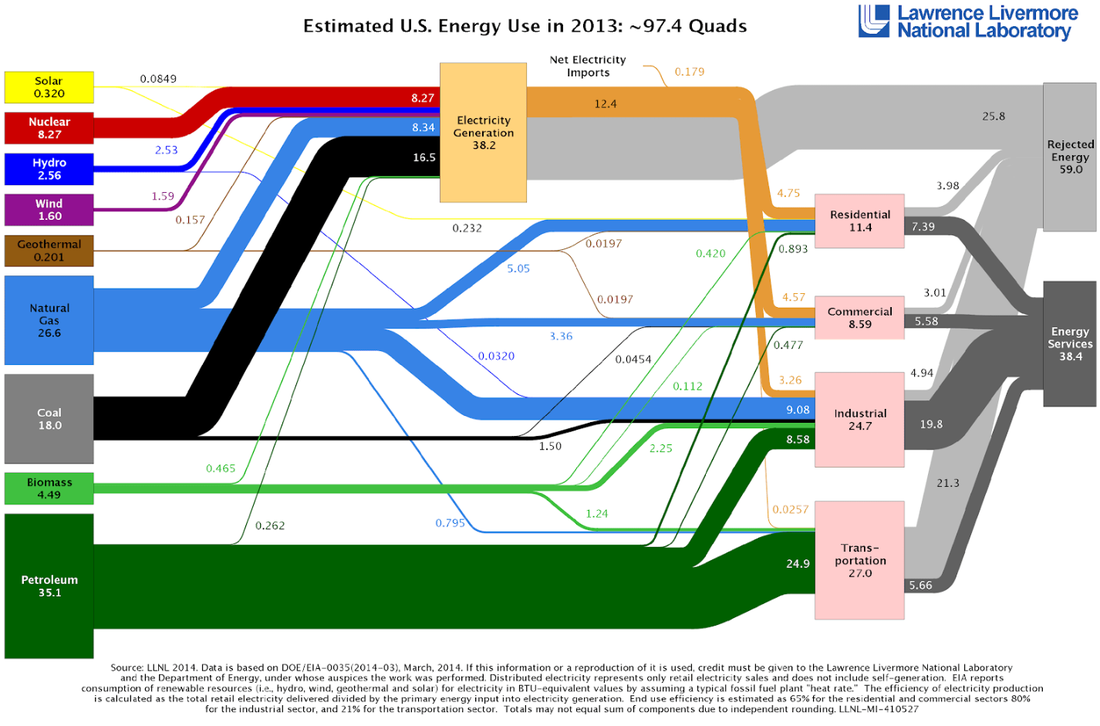
One of the energy flow charts we examined
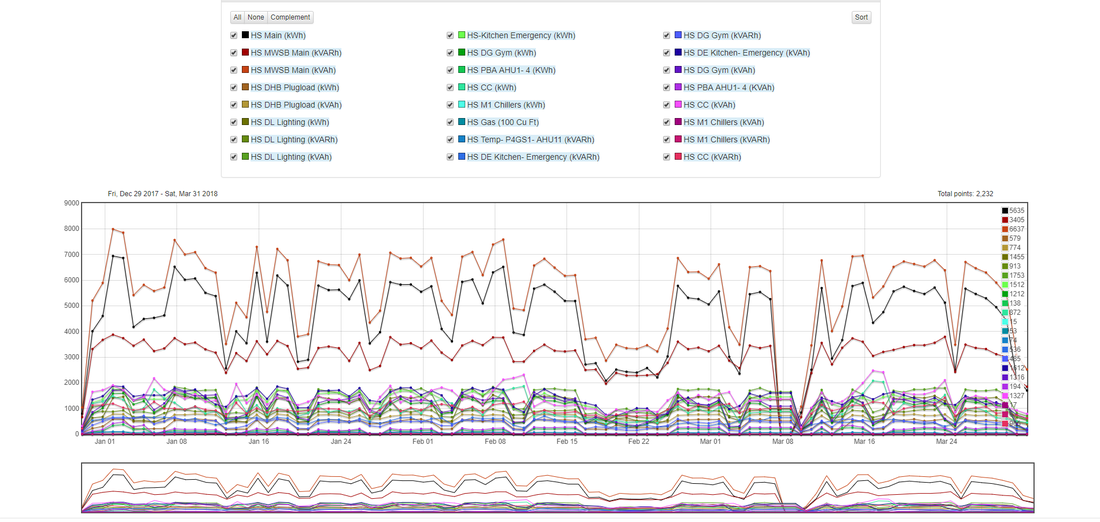
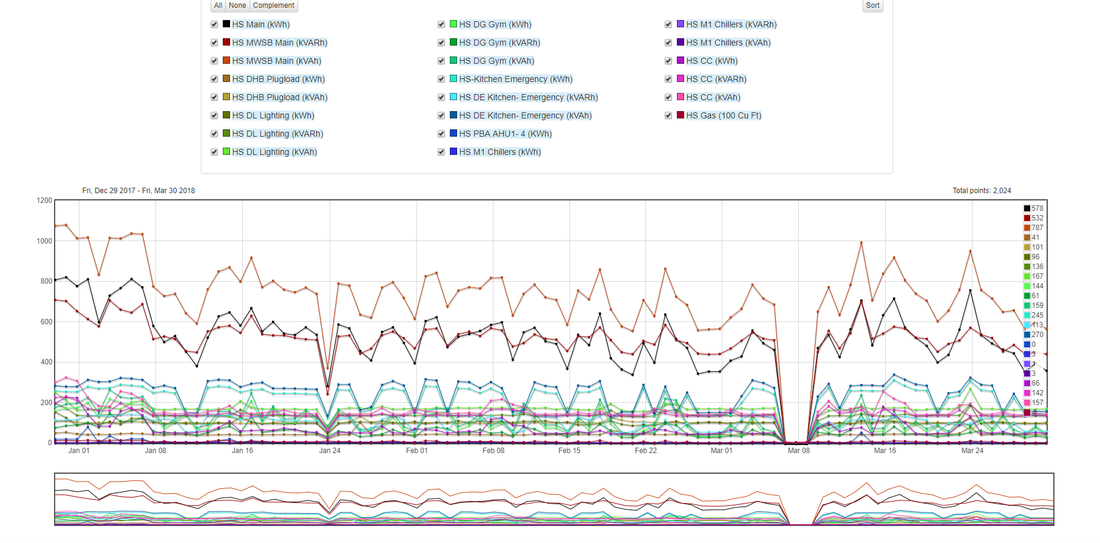
The graphs our dashboard produced from CSV files
A graph of the energy our high school used between 11:00 PM and 4:00 AM
In addition, we setup our API, the buildingEnergyAPI. Using this tool, we connected to a dataserver containing the current condition (temperature, CO2 levels) of every room in our school. We then wrote a python script to read the condition of every room from this dataserver and reformatted the data to store it into a CSV that our plotting software could read. The code I wrote for this is shown below:
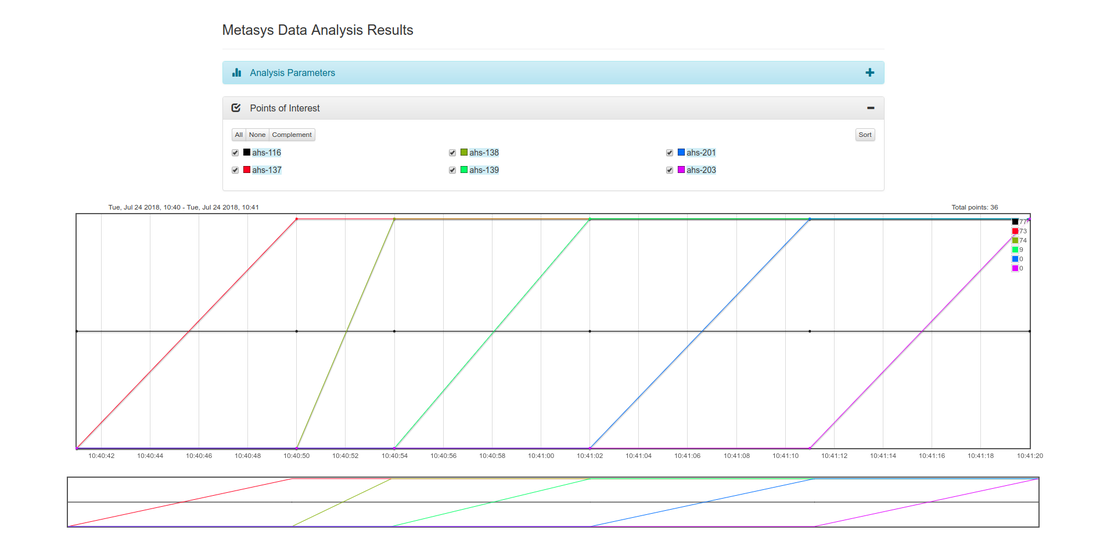
Plotting the file ahs_air_out.csv that the code creates produces the following result:

0 Comments
Leave a Reply. |
About the AuthorA member of a small, select group of high school students tasked with writing software to save our town energy. Archives |

 RSS Feed
