
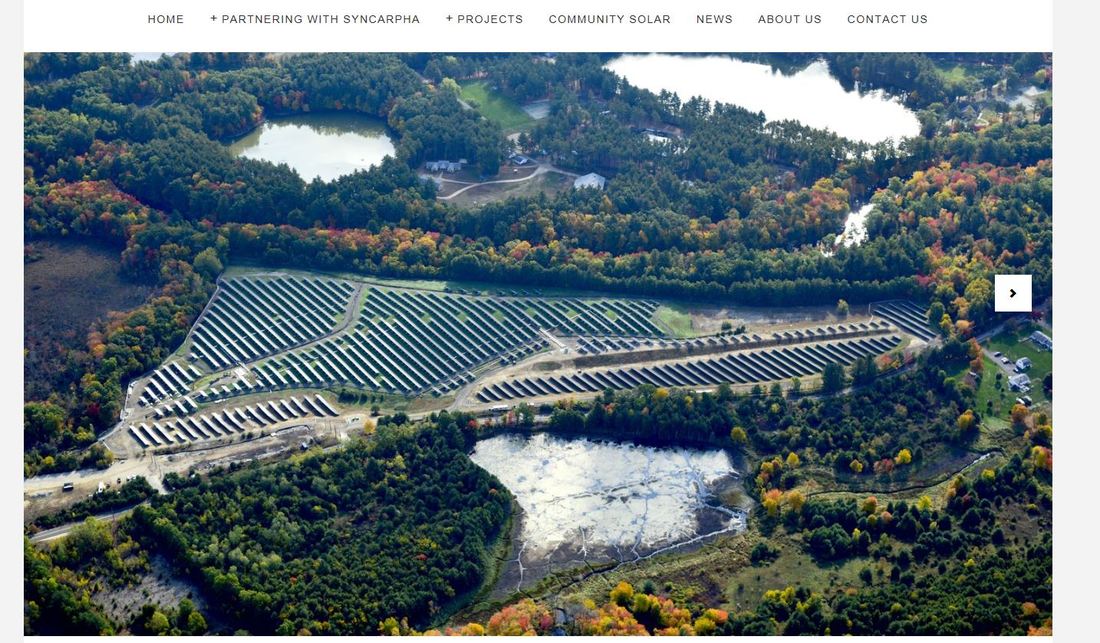
The solar plant at the Palmer Landfill, where the town gets its solar energy
Today, we also revisited our program from last time, HighCO2.py (See Day 2). Upon further examination of our data file, we realized that it included both weekdays and weekends.
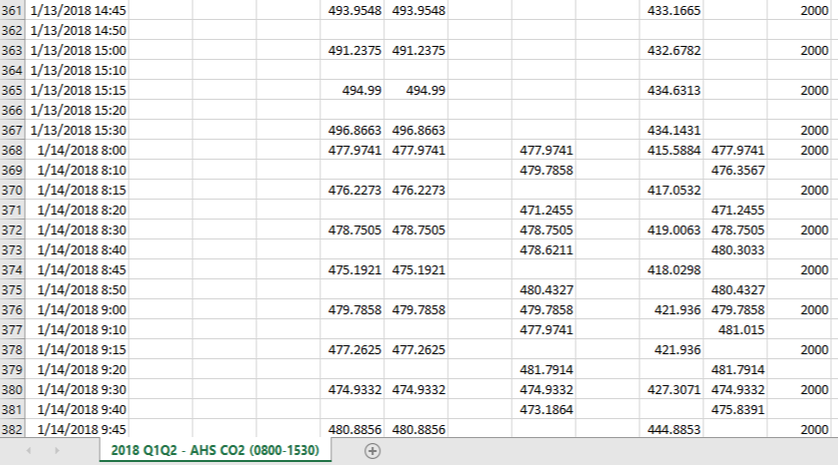
The data in our CSV. Notice that January 13th was a Saturday and the 14th was a Sunday
As there is no school on Saturday or Sunday, our programs should've ignored them, as the extra data skewed our results. To fix this, we learned about working with datetimes in pandas, and I combined this new knowledge with pandas filtering, and updated the file as shown:
Running this script gave me the following output:
By examining this data, I came to the conclusion that zones 18 - 20 have a big CO2 problem. This may be due to a lack of ventilation, or it may be linked to the third floor in general. Further investigation will be required to learn more.
After this, I was tasked with finding all the classrooms which, during school hours, in the month of June specifically, had an average temperature of at least 75 degrees Fahrenheit. June is the hottest month of our school year, and many rooms, especially on the third floor, can often feel way too hot, so this script helps point out the particularly hot rooms:
Running this script gave me the following list of 55 different rooms! That's a lot of hot rooms!
Finally, I wrote a script that analyzed the electricity used by the Collins Center throughout the years 2016 and 2017, and outputted all sorts of comparisons and statistics:
Running this script gave the following output:
Unfortunately, I will miss the next 3 meetings, as I am going away for the long weekend. I will attempt to continue my work remotely and document my progress here, but be warned - I will definitely have less information and/or scripts.
0 Comments
Leave a Reply. |
About the AuthorA member of a small, select group of high school students tasked with writing software to save our town energy. Archives |


 RSS Feed
